- Don's Trading Desk
- Posts
- Gain an Edge This Earnings Season With This Little Known Metric
Gain an Edge This Earnings Season With This Little Known Metric
Don Kaufman
July 12, 2024
I love to nerd out when it comes to options trading.
After all, I built and ran education for thinkorswim and TD Ameritrade for 15 years.
But what I’m about to share with you isn’t some theoretical mumbo jumbo…
It’s a way to look at the options market, which will help you make better trading decisions.
It’s something the pros rely on constantly to gain an edge in the market…but something amateurs really think about.
I know because I’ve observed several million retail trading accounts throughout my career.
So What Am I Talking About?
It’s something called strike skew.
You see, the way the options market works is simple.
It’s driven by supply and demand.
If demand for an option is high, it becomes more expensive. If there is a lot of selling pressure in that option, it becomes cheaper.
And all of this is reflected by the options implied volatility.
That’s why when you look at a set of options, you’ll see that they don’t have the same volatility.
I’ll show you how to analyze this strike skew to make better trading decisions.
Types of Strike Skew
Call Skew:
Flat or Downward Slope: Implied volatility decreases as the strike price increases. This can indicate lower concern about large upward moves in the underlying asset's price.
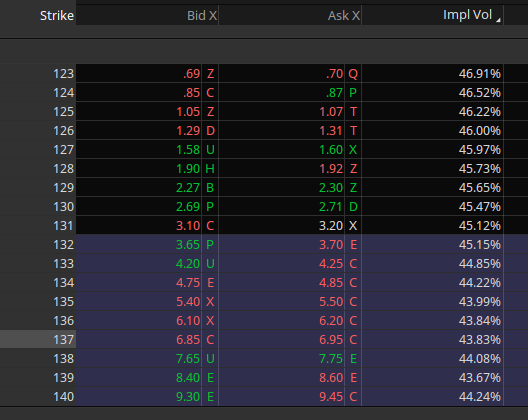
For example, let’s take a look at Goldman Sachs, which is set to report earnings on Monday.

As you go farther out of the money on the call side you’ll see how implied volatility decreases.
So what does this tell me?
Holders of the stock are likely selling OTM calls to hedge their position ahead of earnings.
The option market is implying about a 4.5% move and based on the call skew it expects to fall within that range because there is no crazy demand for really deep OTM calls.
Upward Slope Skew:
Implied volatility increases as the strike price increases, reflecting greater demand for options and capitalizing on significant upward moves.
Where do we see that?
We actually see it in some Tesla calls right now.

As you go further OTM, implied volatility is rising.
Speculators are trying to catch the move up and are willing to pay up for options.
And because OTM options are more expensive from an implied volatility perspective, it makes it advantageous to trade strategies like debit spreads.
If you own the stock and want to collect some income, selling calls can also be advantageous with this skew.
Put Skew
Volatility Smile: Implied volatility is higher for both deep in-the-money (ITM) and deep out-of-the-money (OTM) options compared to at-the-money (ATM) options. This creates a "smile" shape when plotted on a graph.
We actually see this in Tesla put options right now.
I know, there’s a lot of action in Tesla, and we’re seeing bets being placed on both sides.

Volatility Smirk: Implied volatility increases as the strike price decreases (for puts). This indicates higher demand for lower strike puts, reflecting concern about significant downward moves.
And this is what we’re seeing in NVDA options right now…
If you were bearish NVDA, buying a debit spread can be advantageous because you are selling the more expensive volatility.
By the way, all these examples I’m showing are of options expiring next week.
Does This Stuff Matter?
If you want to graduate beyond the basics of trading calls and puts and want to be a more strategic options trader than yes.
Armed with this knowledge, you’ll be able to construct better options trades, which can potentially tip the scale in your favor.
Of course, this is particularly as we head into earnings season.
Oh…
If you haven’t watched a replay of my earnings presentation, make sure you do.