- Don's Trading Desk
- Posts
- Tonight's Tech Earnings: Stop Guessing, Start Trading Smart 💡
Tonight's Tech Earnings: Stop Guessing, Start Trading Smart 💡
Here's What The Options Market Is Missing
Don Kaufman
October 31, 2024

Alright folks, let me tell you something about trading earnings - and this is gonna get interesting.
Look, we're talking about Palantir (PLTR) reporting on November 4th, and I'm gonna break this down in a way that'll make absolute sense.
This is what I love about the markets, and you're gonna love this too.
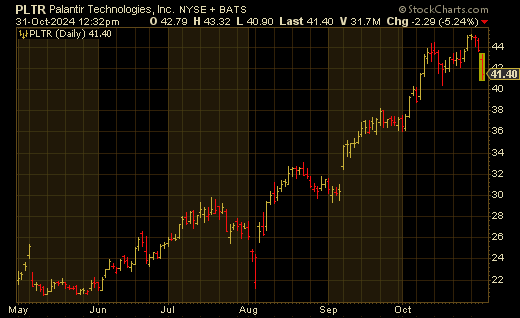
On any regular day, PLTR moves about $1.40 - that's your normal day-to-day action. But here's where it gets wild, and I mean WILD.
If you look at the at-the-money straddle right now - and this is gold, Jerry - the option market is pricing in a $5.50 move.
That's not a typo, folks. We're talking about an 11.5% expected move for earnings week.
Now check this out - and this is where it gets really interesting - implied vol is sitting at 114%.
Compare that to the average IV of 76.2%. That's not just a little bump, that's massive! And I trade this stuff every single day.
Now folks, before we dive into why this volatility explosion matters, let me hit you with something fascinating about options theory - and this is important stuff.
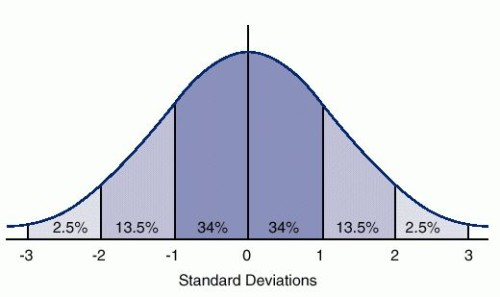
Look, the models tell us something really interesting - a stock has a 50/50 shot of going up or down. I know, I know, you're thinking "Don, that's obvious!"
But hang with me here because this gets good.
Those fancy option pricing models - and I've worked with these for decades - they're built on this idea of normal distribution. Think of it like a bell curve, right?
And this is where standard deviation comes into play.
Now, I love this part because it's where most traders get lost, but I'm gonna make it crystal clear.
When we're looking at PLTR with that 76.2 IV index - that's telling us something specific about standard deviation. Let me show you exactly what I mean.
At $41.38, we multiply that by .762 - boom, there's your $31.53. But here's where it gets really interesting - and this is the part most traders miss - option volatility is expressed annually.
That's right, ANNUALLY.
But who trades annually? Nobody I know!
So we gotta convert this to daily terms. We take that square root of trading days - about 15.9 - and now we're cooking with gas. $31.53 divided by 15.9 gives us that $1.98 daily range.
That's what we're really looking at 68% of the time.
But here's what really gets me excited - and this is where the opportunity is HUGE.
During earnings, that implied vol spikes like crazy because nobody - and I mean NOBODY - knows what's gonna happen.
But what we do know is that after earnings, that vol crashes harder than a lead balloon.
And this is why buying naked calls or puts during earnings is like playing with fire.
Trust me, I've seen thousands of traders get burned this way. You need a MONSTER move just to overcome that vol crush.

Now, here's where it gets really interesting. We've got the biggest tech names reporting this week - Apple, Intel, and Amazon (tonight).
And while everyone else is out there throwing darts blindfolded, we're looking at this strategically.
I've been doing this since my thinkorswim days, watching millions of trades, and let me tell you - there's a better way to play this.
It's not about guessing direction. It's about understanding the vol patterns and playing them smart.
That's all I ever ask for - some smart, strategic trading instead of gambling. Because at the end of the day, that's what separates the traders who make it from those who don't.
And folks, that's what trading is all about - having a strategy, understanding your risk, and most importantly, knowing what the market is really telling you through these numbers.
Want to learn how I trade earnings?
Ready to stop gambling and start trading earnings with confidence?
To your success,
Don Kaufman
P.S. Blake Young will go live tonight after the bell to talk about my earnings strategy and break down the latest earnings reports. Click here to join him at 4 PM ET.